
BUY · SELL print only when
three trend filters agree.
Indicators that fire constantly are easy to find. Vertex does the opposite: it filters. Detector keeps only the signals that clear every gate, then marks where to step back in with a small triangle. UpDown and Line hold the direction, and two sub-panes watch for exhaustion and reversal. Five indicators, one set.
The small triangle is the entry.
The big BUY or SELL sets the direction. The small triangle points at where to climb back on inside that direction — a signal for joining a move that is already under way.
Only with the trend
When the cloud (EMA 21/50) is green only buy-side triangles appear; when it is red, only sell-side. Price must also sit on the right side of SMA 200 with the short-term slope (EMA 27) pointing the same way.
Four engines look separately
An EMA channel flip, an EMA 9/21 cross scored on nine checks, a Bollinger/ATR trend flip, and an EMA 12/26 cross with its own score. If any one of the four catches the trend resuming, the triangle prints.
Timeframe labels show overlap
Next to the triangle you get labels like 1H · 15m — the timeframes that fired at the same bar. More lines mean more timeframes pointing the same way.
Stepped through bar by bar on replay.
Recorded on TradingView bar replay, moving one bar at a time through Nasdaq 100 futures (NQ) on the 15-minute chart, with Vertex Detector V-12, Vertex Line and Vertex RSI all loaded. You can watch the order the signals arrive in.
This is a replay of past bars. Real trading differs in fill price, slippage and the time it takes to decide, so the same result will not repeat, and nothing here guarantees future returns.
MNQ 15-minute, one month — January 2026
We ported the Vertex signal rules into a NinjaTrader strategy and ran it for a month. Of the timeframes we compared, 15-minute bars performed best.
33 trades · 48.5% win rate · avg win $103.01 / avg loss $48.61 · commission and 1-tick slippage included
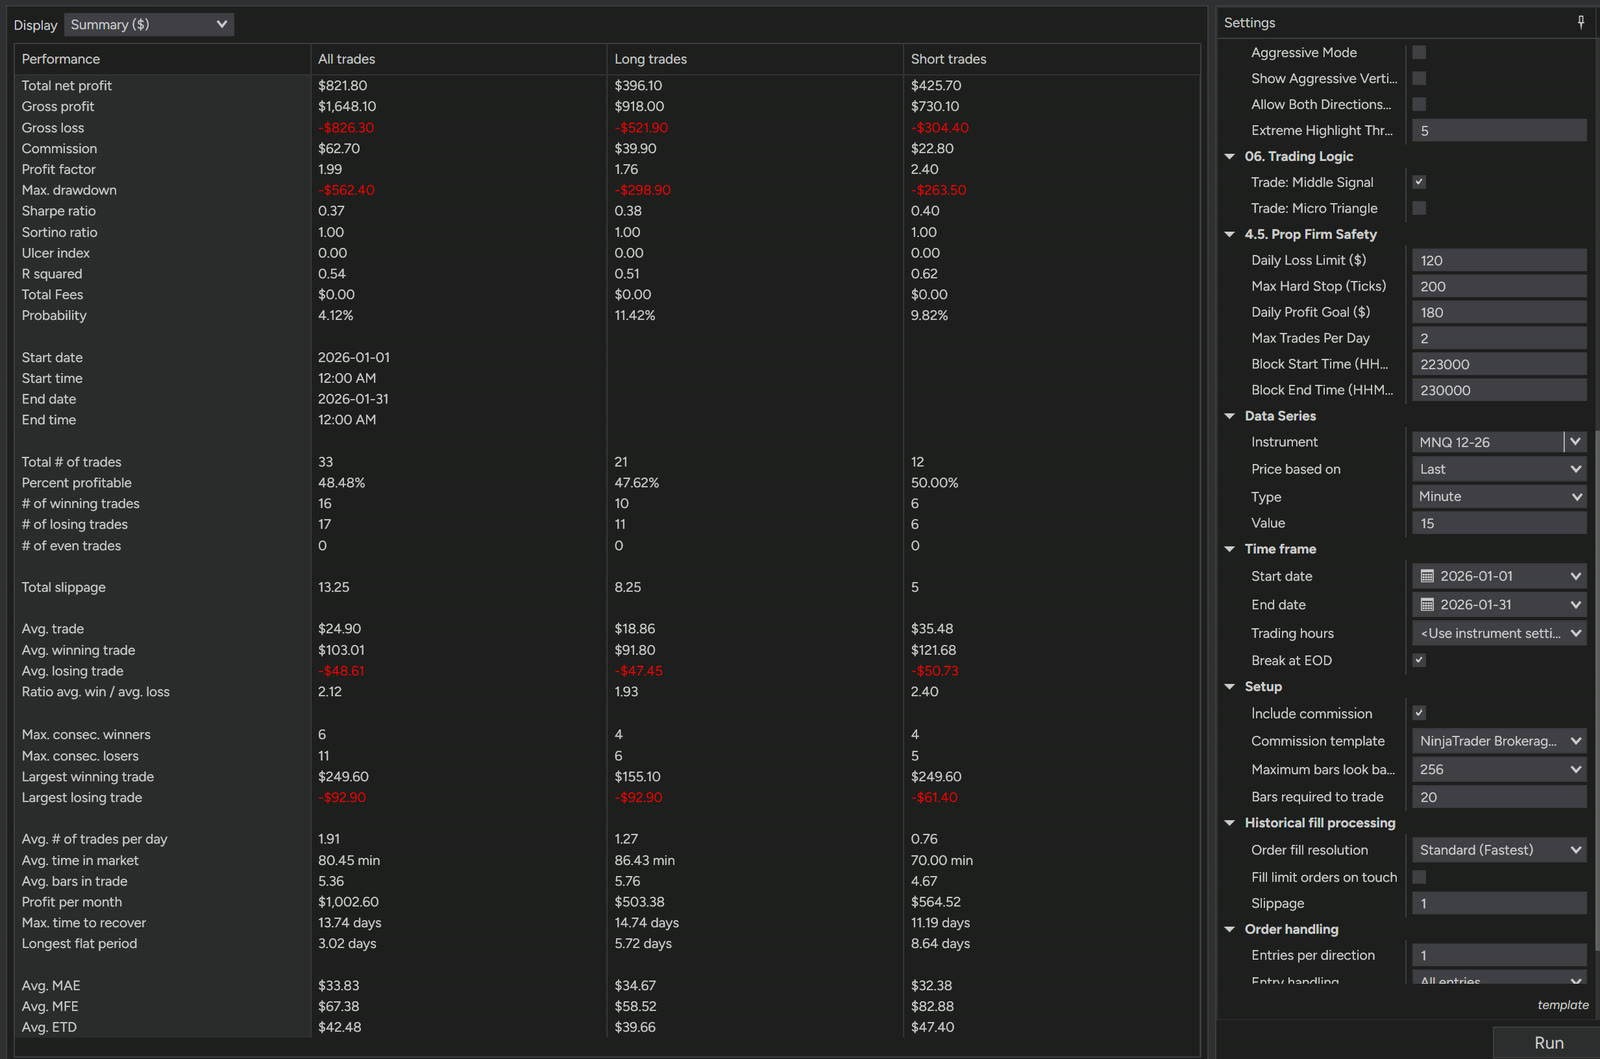
How to read these numbers
- Watching this indicator does not mean you will make money. Fewer than half the trades win; the model works by letting winners run bigger than losers.
- Stretched to a one-year scale, the maximum drawdown reaches $1,386. In other words, this model can lose $120 eleven times in a row. Have the capital and the rules to sit through that first.
- These results come from betting the same fixed size every time (1 MNQ contract). Adding contracts, or sizing up after a loss, changes the outcome completely.
- This is hypothetical performance on past data. Real fills, slippage and decision time differ, so live results will not match, and nothing here guarantees future returns.
Vertex sells indicators only. The TradingView and NinjaTrader strategies (automated trading) used for this backtest are not for sale, for legal reasons.
Five indicators, five different questions.
Trying to judge everything with one indicator gives you either too many signals or signals that arrive too late. So the work is split: three on the main chart, two in sub-panes, read from top to bottom.
Vertex Detector V-12
Filtered BUY·SELL, the small triangle that marks the entry, the trend cloud, exhaustion checks and multi-timeframe labels — all on the candles.
Vertex RSI
A Laguerre RSI that reacts far faster than the usual one: it changes colour above 80 and below 20, and dots every peak and trough.
Vertex WaveTrend
The line turns yellow as a warning, and a red or green dot confirms the top or the bottom.
Vertex UpDown
Prints UP·DOWN labels on the bar where the EMA channel crosses, and colours the candles by direction. More →
Vertex Line
One WMA 55 line tells you the side by its colour: green means long only, red means short only. More →
Not an indicator that gives signals — one that filters them.
Six things sit on top of the candles. Follow the numbers.
- 1
Main BUY · SELL
The big triangle. Three trend filters vote, and it prints only when enough agree and few object. If price has already run into the top 15% of the trend band it blocks buys, and the bottom 15% blocks sells, so you are not chasing.
EMA 200direction and sideEMA 50 · 200stacked in orderATR trend bandswing direction→ signal on agreement - 2
Middle signal (small triangle)Entry
Where to step back in, inside the direction the main signal set. One of four engines has to catch the trend resuming while the cross line, SMA 200 and the short-term slope all point the same way. More →
- 3
Cross line · cloud
EMA 21 and EMA 50 with the space between them filled. Green is an up stretch, red a down stretch. It is also the direction the small triangles follow.
- 4
Yellow check ✔
When the fast Laguerre RSI turns over above 98.5 it prints above the candle; below 1.5 it prints underneath. It marks where a short-term run or flush is burning out.
- 5
X mark
A bar that set the highest high or lowest low of the last 150 and turned straight around, where the preceding move ran more than two standard deviations faster than usual. It flags candidate tops and bottoms.
- 6
Multi-timeframe labels
Of 4h, 1h, 30m, 15m, 5m and 1m, the ones that printed a small triangle at the same moment are written next to the candle. You see the overlap without hopping between charts.
Faster than a normal RSI, and it says overbought in colour.
A Laguerre RSI, filtered in four stages and smoothed once more. It reaches the extremes sooner, and it changes colour the moment it gets there.
- 1
The fast RSI line
Calculated from the average of high, low and close. Between 80 and 20 it runs grey, and that middle band sits behind it as a light shade.
- 2
Colour flip above 80, below 20
Above 80 it turns red; under 20 it turns green. The colour alone tells you whether you are in overbought or washed-out territory.
- 3
Peak and trough dots
Every time the line turns over, a red dot marks the top and a green dot the bottom. Dots inside the extreme zones are the ones worth watching.
- +
Tied to Detector
The same Laguerre RSI shows up inside Detector as the yellow check ✔, but only at the far extremes of 98.5 and 1.5. You watch the flow in the sub-pane and confirm the extreme on the main chart.
It warns in yellow before it turns.
WaveTrend, smoothed once more, with the moment the faster inner line changes direction first pulled out as a warning.
- 1
Yellow line · early warning
The smoothed line is still rising while the faster line inside has already turned — so the line goes yellow. It is the stage before a dot appears.
- 2
Red dot · top confirmed
The slope hits zero and the line turns over. It prints one bar later, at the bar that turned.
- 3
Green dot · bottom confirmed
The same thing on the way down. Dots outside the ±53 and ±60 guides are turns from inside overextended territory.
- +
5 alerts
Take the yellow warning, the red dot and the green dot separately or bundled. There is also one combined alert for warnings plus confirmations.
Top to bottom, in four steps.
An example of the order to work through. It is not a rule that tells you to trade — it is how to line up what the indicators are showing.
- 01 · Direction
Which side are we on
Use the cloud colour and the last big BUY·SELL to decide whether this is a buy stretch or a sell stretch.
Detector 1 · 3 - 02 · Entry
Did a small triangle print
A small triangle in that direction is an entry candidate. Check the timeframe labels beside it for how many timeframes overlap.
Detector 2 · 6 - 03 · Overbought
Has it already run
If Vertex RSI is sitting red above 80, or a yellow check has printed, be wary of chasing.
Vertex RSI 2 · Detector 4 - 04 · Reversal
Any sign it is about to turn
WaveTrend's yellow warning and top dot, plus the X marks, tell you the direction may be about to flip.
WaveTrend 1 · 2 · Detector 5
26 conditions, so you don't have to watch the chart.
Pick the ones you need, set them as TradingView alerts, and they arrive as app pushes or email. Master alerts bundle several signals into one.
Vertex Detector V-12 17
Vertex WaveTrend 5
Alert messages carry the ticker and the price.
Vertex UpDown 3
Vertex Line 1
UP · DOWN on the bar where the channel crosses.
Two lines built from the EMA 10 of the highs and the EMA 10 of the lows. When they cross and that bar closes green you get UP; closing red gives you DOWN. A cross on its own is not enough, which cuts out the noise that fires during pullbacks.
- 1
UP label
The low EMA line crosses above the high EMA line and that bar closes green — it prints under the candle.
- 2
DOWN label
The reverse: the lines cross downward and the bar closes red, printing above the candle.
- 3
Candle colour
A reference line is built from the 21-bar high and low minus three times average range (ATR); close above it paints the candles green, below it red. You can read direction even where no label printed.
- +
3 alerts
UP, DOWN, and either of the two — three alert conditions are built in.
The upside — once it picks a direction you can hold it for as long as the trend runs. It trades rarely and aims to take the whole move.
The downside — in chop, UP and DOWN alternate and losses stack up. When no direction is holding, sitting out is the better trade.
Where to get out — take exits from Vertex Detector's yellow check (✔) or X mark. Detector is part of the Vertex 5-indicator set.
One line that tells you the side by its colour.
A single line — the WMA 55 of the midpoint between high and low. Its colour moves through five steps: green as upside momentum builds, yellow as it drains, red once it turns down. When price crosses the line, an alert fires.
- 1
Five colour steps
The shade deepens with where WMA 55 sits against its own EMA 3 and how long it has held that direction. Deeper green means stronger upside, deeper red stronger downside, and yellow is the in-between where momentum is draining.
- 2
Price crossing
Price breaking above the line is the green circle, breaking below it the red one. You can set an alert on that cross.
- 3
Use it with Vertex RSI
The lower pane is Vertex RSI. The line colour sets the side; the RSI sets where you actually step in. The two belong on screen together. Vertex RSI comes with the 5-indicator set.
- +
1 alert
When price crosses the line you get the ticker and the price. One combined alert covers both directions.
The line sets the side, the RSI sets the timing.
When the line is green, look for longs only, and take the entry from Vertex RSI.
When the line is red, don't jump straight in — wait until Vertex RSI turns red (above 80), then look for the short. The trend is down and you are waiting for the bounce back up.
Never take a trade against the line's colour.
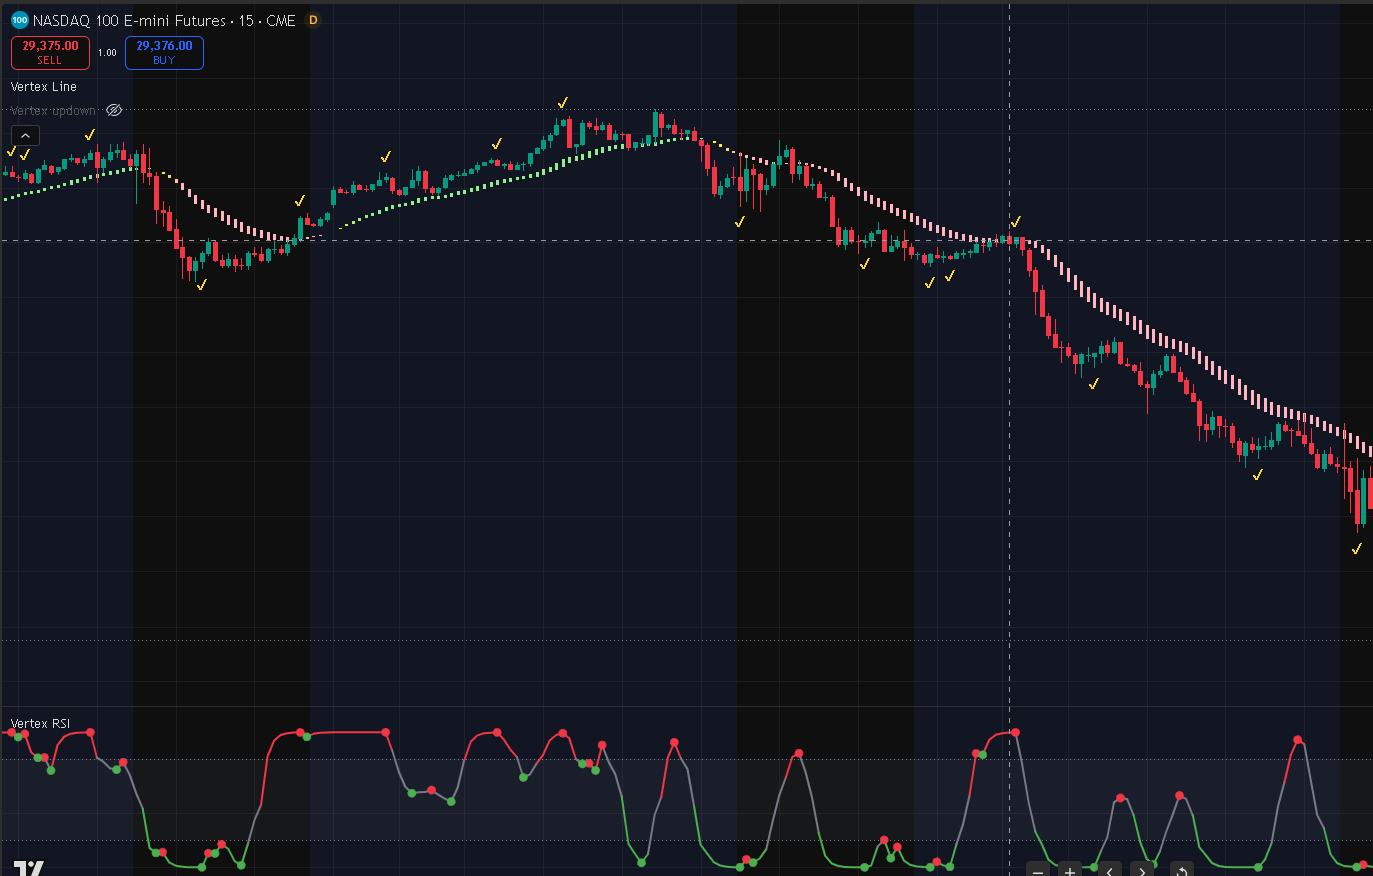
Here it is on a live chart.
Vertex Line and Vertex RSI together on Nasdaq 100 futures, 15-minute. Put the colour changes on the line next to the RSI colour at the same moment and compare.
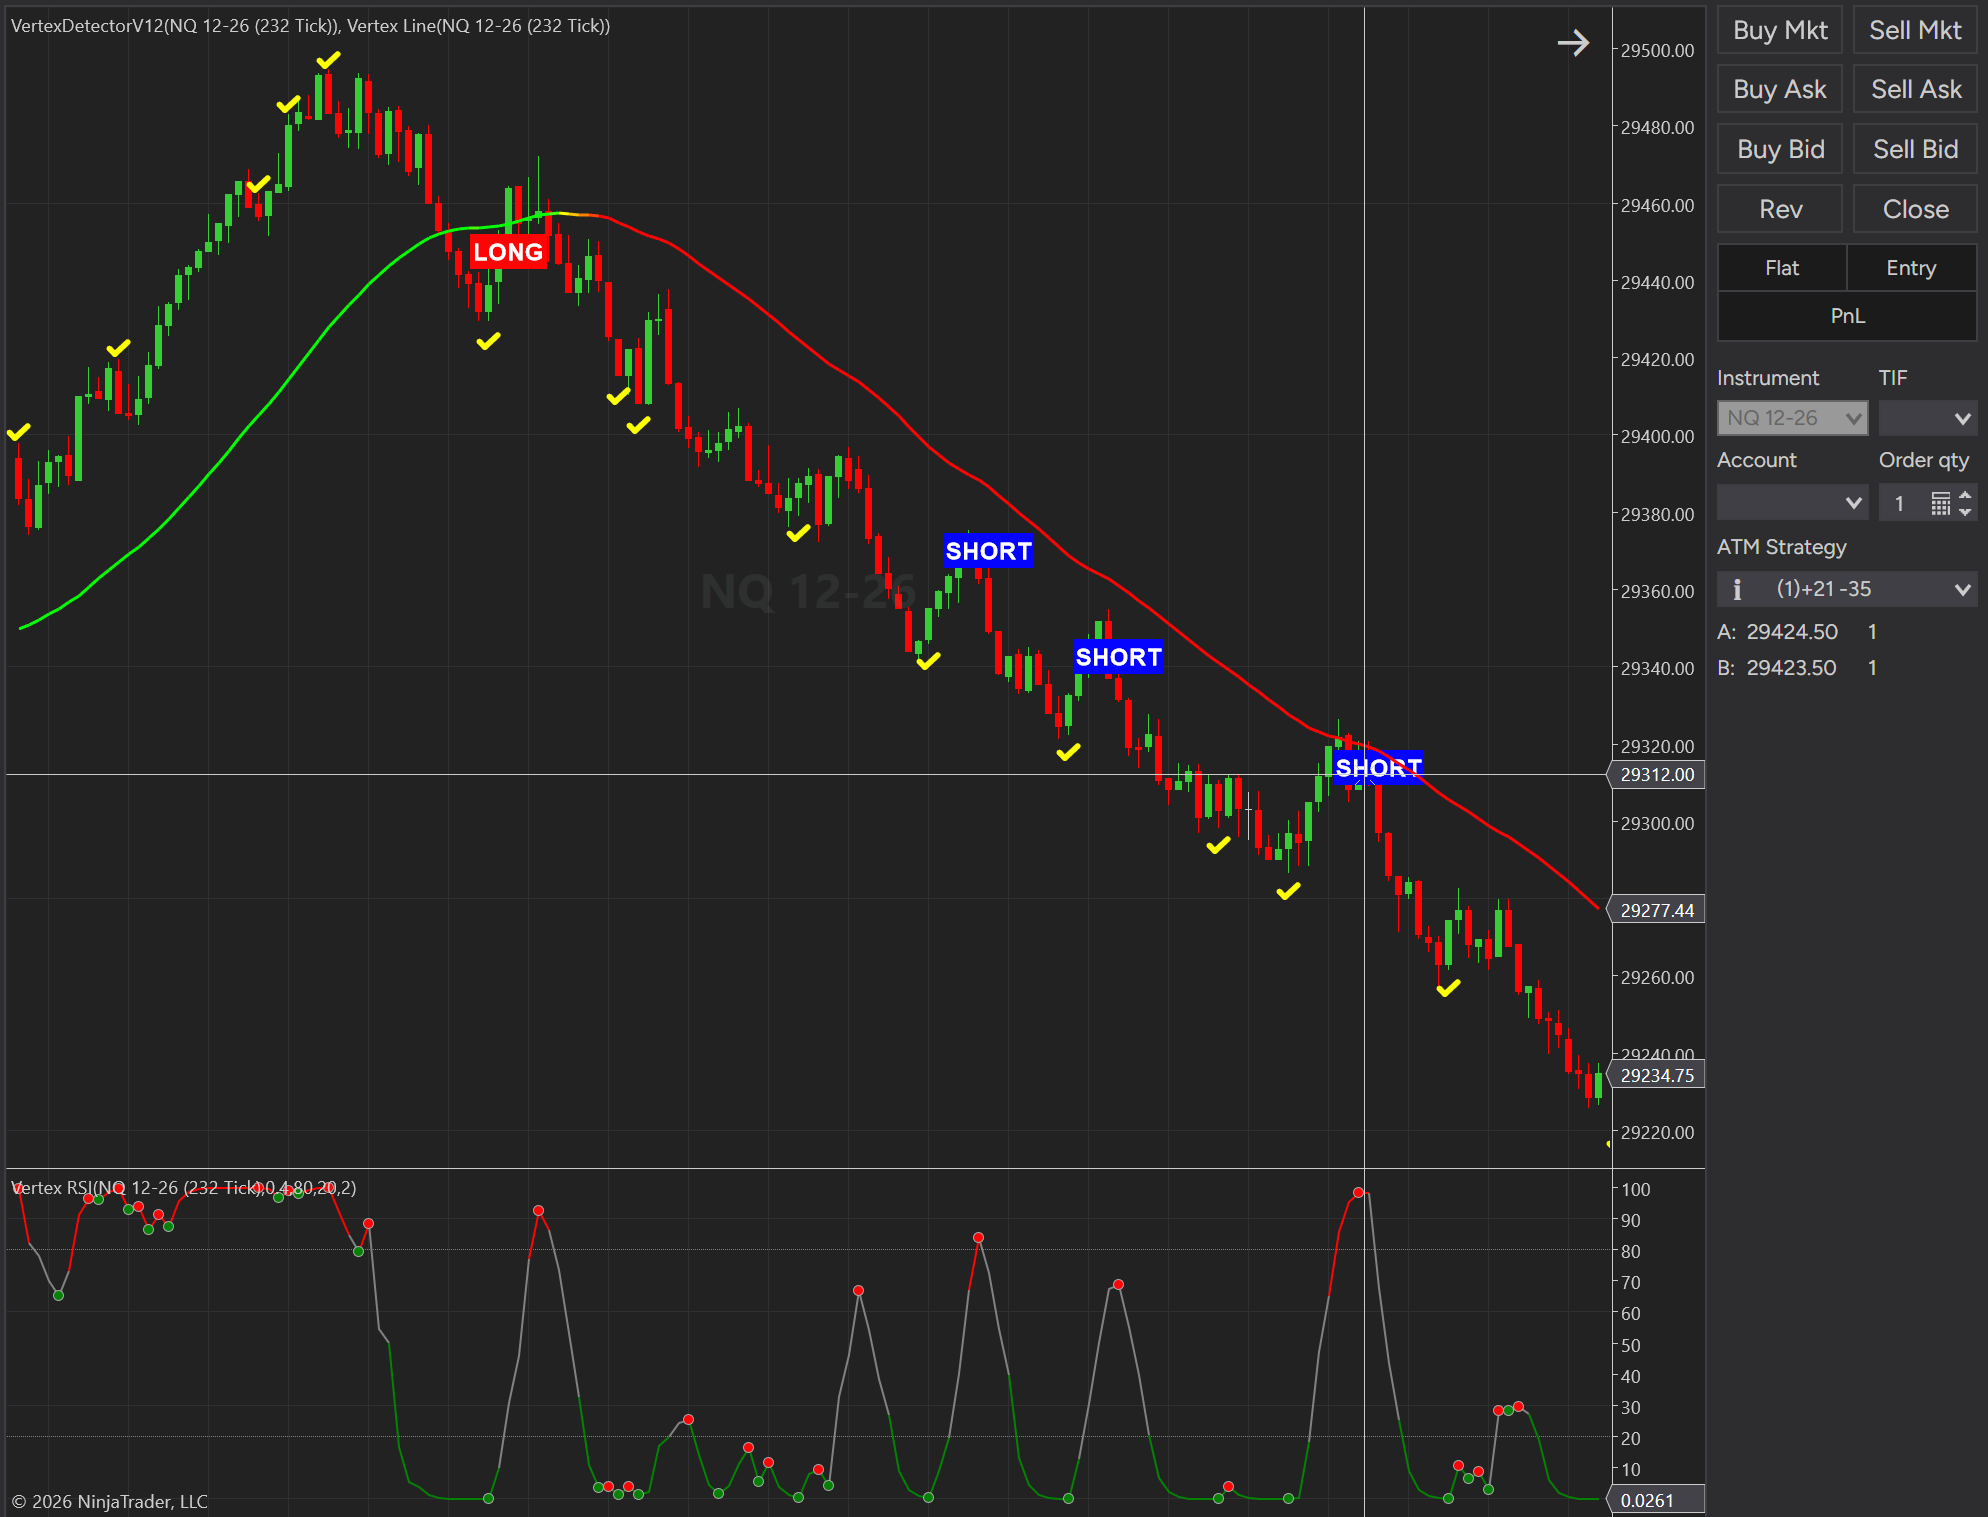
The same indicators run on NinjaTrader.
Beyond the TradingView versions there is a NinjaTrader build. Below is a real screen with Vertex Detector V-12, Vertex Line and Vertex RSI loaded on NQ futures, 232-tick. It sits right next to the order panel.
Two months free — one short form.
Leave an email address and your TradingView username and we will grant Vertex UpDown and Vertex Line. Yours free for two months.
Three steps from payment to your chart.
Free or paid, they arrive the same way.
Sign up on Whop
Pick an indicator or a plan and enter your TradingView username as you check out (or as you apply, for the free ones).
Access within 5 minutes
Pay through Whop and access lands within five minutes. Find them under 'Invite-only scripts' in the TradingView indicator window.
Add them and set alerts
Drop them on the chart and set whatever alerts you want. A setup guide comes with it.
Questions we get asked
Do signals change or disappear later?
Main BUY·SELL is confirmed once the bar closes. The dots that mark tops and bottoms (the yellow check, Vertex RSI and WaveTrend dots) need one more bar to confirm the turn, so they print one bar later, on the bar that turned.
Can I enter on the small triangle alone?
The small triangle only shows a candidate entry inside a direction that is already set; it guarantees nothing. Check whether overbought signs (Vertex RSI red, a yellow check) or a reversal warning (WaveTrend yellow) are showing at the same time, and decide your own stop before you act.
Which timeframes does it work on?
All of them. The main signal is calculated on the 1-hour chart by default, so the same signal shows up on 5-minute and 15-minute charts too; you can change or switch off that reference timeframe in the settings. The timeframe labels check six frames, from 4 hours down to 1 minute.
Does a free TradingView plan work?
You can add the indicators on a free account. Free plans do limit how many indicators fit on one chart and how many alerts you can set, so running all five at once or setting several alerts may need a paid plan.
Can I try before paying?
Two ways. The Vertex 5-indicator set starts with a 14-day free trial on Whop, and cancelling inside the trial means no charge. And Vertex UpDown and Vertex Line are free for two months on request — no payment details are taken for those, so nothing auto-charges. After the free period they are $8.90 a month each, or $149 for lifetime access.
Does it trade automatically?
No. Every indicator draws information on the chart and sends alerts; none of them place orders. The trades and their outcomes are yours.
What markets can I use it on?
Anything you can chart on TradingView — stocks, crypto, futures, forex, indices. Some middle-signal engines use volume, so on instruments without volume data you will see fewer small triangles.
When do I get access?
Pay through Whop and you can use it within five minutes. Other payment methods can take longer to grant, and we add the delay back onto your access period.
How do cancellations and refunds work?
Cancel any time from your Whop account and you are not billed from the next cycle. Access ends when the paid period does. See [refund policy] for refund terms.
Risk disclosure
These indicators and this page are tools for education and chart analysis. They are not investment advice or a recommendation. The sample charts on this page are drawn from synthetic data for illustration; the NinjaTrader image is a real screen capture. Neither guarantees future results. Signals drawn on past charts do not promise future profit, and trading financial products carries the risk of losing your capital. Every decision and its outcome is your own. TradingView is a trademark of TradingView, Inc., and Vertex Chart is not affiliated with TradingView.